What I do


Product & Organizational Leadership
I love driving organizations of passionate people towards goals that improve the lives of our customers. I have built organizations and products from scratch as well as taken on existing challenges across a diverse set of product types, everything from low level hardware to mobile and desktop apps to some of the largest cloud services, with some of the most complex P&L systems, in the world.
My organizations are people first - initiatives are driven bottoms up against a high level vision that is set not just by myself and my leadership team, but also by every team member. I don't believe in crunch time, though I do believe that on the rare occasion that a team member may be asked to work a little harder they deserve just compensation for that extra - regardless of it is for an oncall shift or an upcoming product launch.

Bringing the Dev to DevOps...
True product ownership means dev teams understand the lifecycle of their products from the early stages of planning and development to deployment and operations in live.
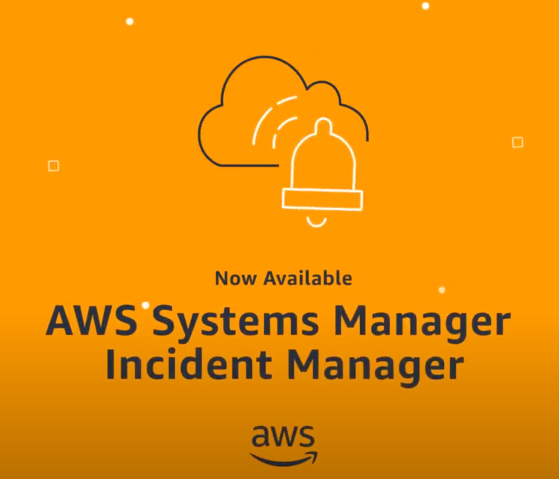
DevOps should not a burden for devs - my teams & I focused on reducing complexity and repetitive ops work, bringing a dev-oriented "automation first" philosophy to the space. This focus helped AWS significantly reduce the number of people it needed on a central operations teams while significantly cutting down time to detection as well as time to mitigation for large incidents.

Conferences, Webinars, Trainings, oh my!
I get passionate about all things tech, and what better way to share and connect with others in the space than by talking, teaching or training?
My public sessions (list below) tend to be at company conferences, and I also do pre and post-sales executive briefings, consultations and trainings on a range of tech and culture topics. I've had the pleasure of interacting with a range of companies and executives from the smallest to the largest in the world. Please reach out if you'd like to chat!
Architecture & Coding
Experimentation is part of our DNA as developers - we use it to test concepts, motivate others by broadening their horizons, build cool products, and even just to automate away an annoyance. We also use it for somewhat useless fun things (like this animation), that are nevertheless useful for learning new things.
From desktop automation to Spotify notifications to workshops to random useful tools, if you want to get a feel for some of my code you can find my public projects on GitHub.